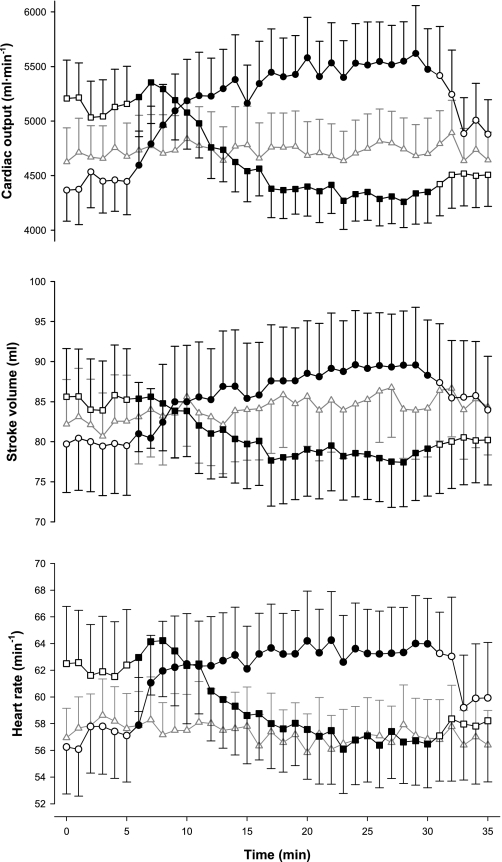
Fig. 5.
Cardiac output (top), stroke volume (middle), and heart rate (bottom) during the 3 main protocols: hypercapnia (circles), hypocapnia (squares), and control (triangles). Closed symbols indicate measurements made under hypercapnic (hypercapnia protocol) or hypocapnic (hypocapnia protocol) conditions; open symbols indicate measurements made under eucapnic conditions. Data are means for 12 subjects; error bars are ± SE.

