Fig. 8.
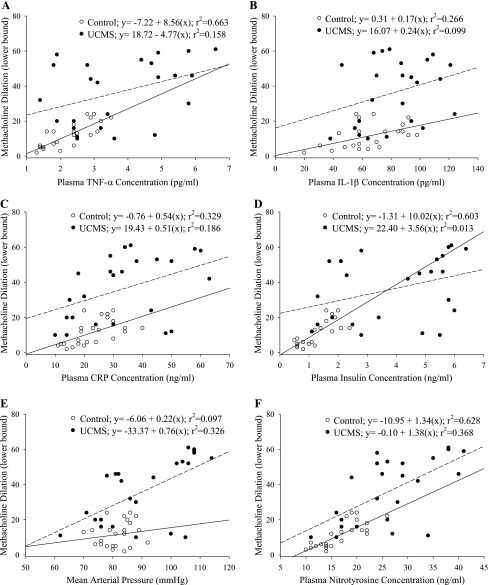
Correlations between vascular reactivity and individual vascular disease risk factors in control (open symbols, solid line) and UCMS mice (filled symbols, dashed line). Data are presented as the lower bound in the methacholine concentration-response curve for an individual mouse vs. plasma concentrations of TNF-α (A), IL-1β (B), CRP (C), insulin (D), mean arterial pressure (E), and plasma levels of nitrotyrosine (F). Also presented are lines of best fit through the data for each group, with the resulting equations and r2 values presented in the legend.

