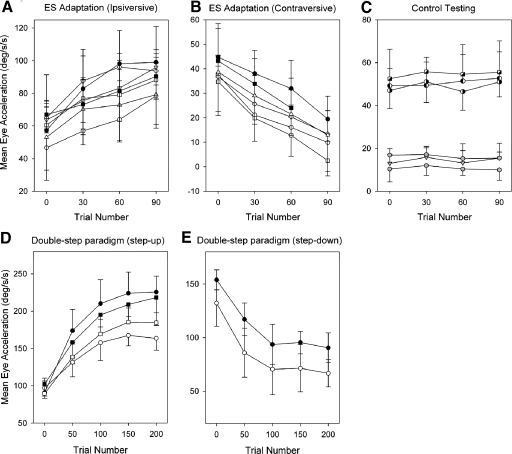
Fig. 8.
Mean eye acceleration during the 1st 100 ms of tracking for 10 trials are shown at 30-trial intervals for 2 monkeys. Ipsi- (A) and contraversive adaptation paradigms (B) and control testing (C) are shown. Eye acceleration during double-step paradigm of step-up (D) and step-down (E) are shown at 50-trial intervals in same subjects. Filled and open circles in A, B, D, and E indicate different monkeys. Half filled symbols and gray symbols in C indicate control testing using target motion alone and NOT stimulation alone, respectively. Different half filled symbols (circle and square) and gray symbols (circle and triangle) indicate different monkeys.

