Fig. 1.
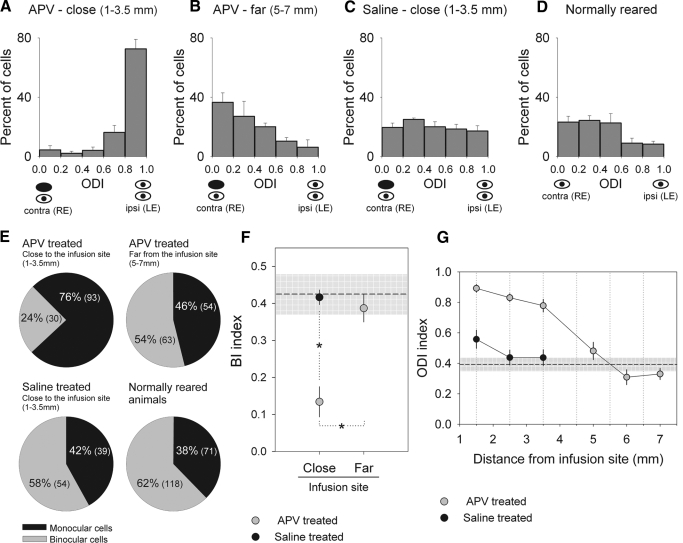
Intracortical infusion of d,l-2-amino-5-phosphonopentanoic (APV) in the left primary visual cortex prevented recovery of deprived (right) eye responses for neurons located near the infusion site (A, 1–3.5 mm, n = 123 cells from 10 recording penetrations in 5 animals), whereas neurons located far from the infusion site (B, 5–7 mm, n = 117 cells from 11 recording penetrations) showed recovery of deprived eye responses. Saline treatment during restoration of binocular vision did not prevent recovery of deprived eye responses for neurons located close to the infusion site (C, 1–3.5 mm, n = 93 cells from 8 recording penetrations in 4 animals). Note that the ocular dominance profiles in B and C are similar to the ocular dominance distribution obtained from recordings in normally reared ferrrets (D, 189 cells from 16 recording penetrations in 5 animals). ODI, ocular dominance index; contra, contralateral; ipsi, ipsilateral; RE, right eye; LE, left eye. Error bars indicate SE. E: pie charts showing the percentage of binocular cells (ODIs from 0.2 to 0.79) and monocular cells (ODIs from 0.0 to 0.19, and 0.8 to 1.0) from APV and saline-treated animals and normally reared ferrets. The respective numbers of cells are also shown between brackets. Note the small percentage of binocular cells from recordings close to the APV infusion site compared with percentages of binocular cells from the other experimental groups. F: mean binocular indexes (BIs) plotted based on the proximity of the recordings to the infusion site (close: 1–3.5 mm, far: 5–7 mm) for APV and saline-treated animals. A BI value close to 0.1 indicates that the majority of the cells are driven exclusively by one eye or the other, whereas a BI shifted toward 0.5 suggests that several cells are driven by both eyes. Mean BI values from recordings close to the APV infusion site are significantly different from BI values obtained from saline and APV control sites (univariate ANOVA, F = 17.088, df = 2, P < 0.0001; Bonferroni test, P = 0.001 for both comparisons). Error bars indicate ±SE. Dashed line represents the average BI values of animals with normal visual experience (normally reared ferrets) and gray shaded area ±SE. G: mean ODI plotted by the distance of the recordings from the infusion site (rounded to the nearest 0.5 mm) for APV and saline-treated animals. APV-treated, number (n) of cells: 1.5 mm, n = 25; 2.5 mm, n = 65; 3.5 mm, n = 33; 5 mm, n = 27; 6 mm, n = 34; 7 mm, n = 56 cells. saline-treated, number (n) of cells: 1.5 mm, n = 24; 2.5 mm, n = 36; 3.5 mm, n = 33. Error bars indicate ±SE. Dashed line corresponds to the average ODI values of animals with normal visual experience (n = 189 cells) and gray shaded area ±SD.

