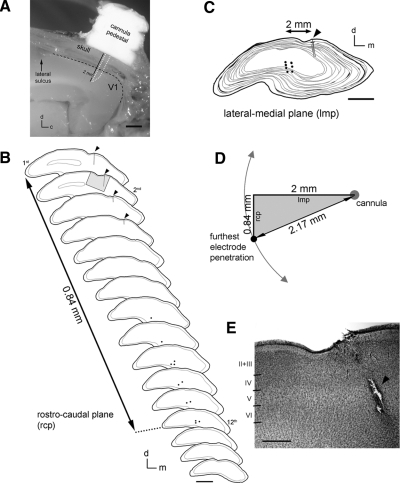
Fig. 2.
A: photomicrograph of a ferret brain depicting the location of the cannula insertion in the visual cortex. The cannula pedestal, skull, and brain were carefully cut along the sagital plane. V1, primary visual cortex; d, dorsal; c, caudal. Scale bar 1 mm. B: camera lucida drawings of coronal sections (70 μm) through V1 of an animal after treatment with APV during binocular recovery of deprived eye responses. Sections are organized from rostral to caudal. Black dots indicate electrolytic lesions made during 2 electrode penetrations located near the minipump cannula (arrowheads, vertical black lines). The distance from the first section with a cannula-lesion track (1st) to the last section showing electrolytic lesions (12th) is indicated. d, dorsal; m, medial. Scale bar, 2 mm. C: superimposed sections shown in B depicting the lateral-medial distance between the cannula placement and the electrolytic lesions. d, dorsal; m, medial. Scale bar, 2 mm. D: diagram depicting the distance from the infusion and the recording sites based on the distances shown in B and C. E: photomicrograph of a Nissl-stained coronal section (highlighted in B, 2nd section, gray area) showing normal cortical laminae near the APV injection site. Arrowhead points to the mechanical lesion made by the insertion of the cannula into the ferret primary visual cortex. Scale bar, 500 μm.

