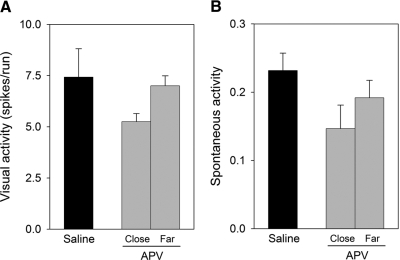
Fig. 3.
Mean visual responses (A) and spontaneous activity (B) of V1 cortical cells for saline- and APV-treated animals based on the proximity of the recordings to the infusion site (close: 1–3.5 mm, far: 5–7 mm). Recordings in saline-treated animals were made at 1–3.5 mm from the infusion site. The number of spikes was averaged over the course of the 10 stimulus runs, and spontaneous activity was determined by recording in the absence of stimulation. Error bars indicate SE.

