Fig. 2.
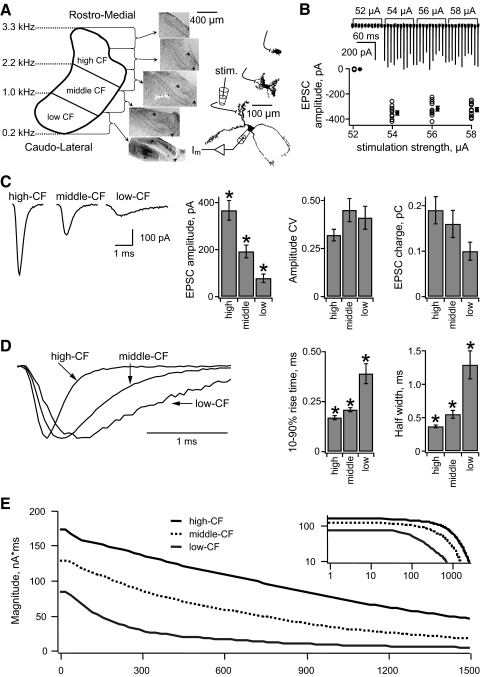
A tonotopic gradient of unitary excitatory postsynaptic currents (uEPSCs) in NL neurons. A, left: a schematic diagram of the tonotopic axis of NL, showing the anatomical sectioning of the nucleus into high-, middle-, and low-characteristic frequency (CF) regions, with approximate CFs at the borders indicated at the left. Middle: photomicrographs of the sequential 200 μm thick horizontal brain slices containing NL from one chick (top 4 slices, Nissl stained; bottom slice contains a biocytin filled low-CF neuron above the *, diaminobenzidine [DAB] reaction). NL is outlined by dotted line. NM is indicated by arrows. Right: representative biocytin-labeled neurons from each of the 3 frequency regions are shown. The patch electrodes show the configuration for somatic voltage clamp and stimulation of the ipsilateral NM fibers. B, top: an example (high-CF neuron) of typical synaptic currents recorded during the minimal stimulation protocol. Ipsilateral NM axons were stimulated at a range of current amplitudes (numbers above the trace) once every 10 s. Each sweep is 15 ms long. The holding potential was −60 mV. Bottom: plot of the individual uEPSC amplitudes vs. stimulation strength. Filled symbols with error bars (offset for clarity) indicate the mean ± SE. C, left: representative examples of average uEPSCs recorded in a single neuron from each tonotopic position. Bar plots (right) of the average uEPSC amplitude (left), coefficient of variation (CV) of uEPSC amplitudes (middle), and average uEPSC charge (right) in NL neurons from each frequency group. D, left: representative examples of average uEPSCs from a neuron in each tonotopic position. Amplitudes are normalized to compare the time courses. Bar plots (right) show the average 10–90% rise time (left) and average uEPSC half-width (right) in the neurons from each frequency group. E: Fourier magnitude spectrum of the average uEPSC recorded in each frequency region. The inset shows the same data on logarithmic axes, over the entire frequency range represented in NL. In all figures the error bars indicate SE and an asterisk (*) indicates statistically significant pairwise differences (P < 0.05).

