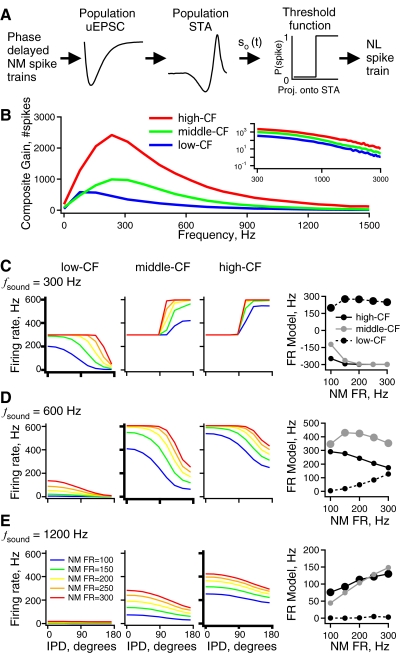
Fig. 8.
NL model responses to simulated NM spike trains at different sound frequencies and intensities. A: a schematic diagram of the LN cascade model of an NL neuron with both synaptic and intrinsic linear filtering stages (similar to Fig. 6). The NM spike trains are passed through experimentally derived synaptic and intrinsic linear filters and the result is thresholded to produce output spikes. A different model was used based on measured responses in each CF region. B: the composite gain vs. frequency due to the combined synaptic and intrinsic filtering in the high- (red), middle- (green), and low-CF (blue) regions. The inset shows the same data on logarithmic axes to illustrate differences in gain at the highest frequencies represented in NL. C: firing rate vs. IPD of the 3 NL models (3 left panels) for input simulated at a sound frequency of 300 Hz. For a given plot, each curve is the model response to a different sound intensity [average NM firing rate = 100 (blue), 150 (green), 200 (yellow), 250 (orange), 300 (red) spikes/s]. Right panel: plot of spike rate modulation (firing rate at IPD = 0° − firing rate at IPD = 180°) at each intensity for the high-CF (black, solid line), middle-CF (gray, solid line), and low-CF (black, dotted line) model responses. D: same as C but for 600 Hz sound frequency. E: same as C but for 1,200 Hz sound frequency.

