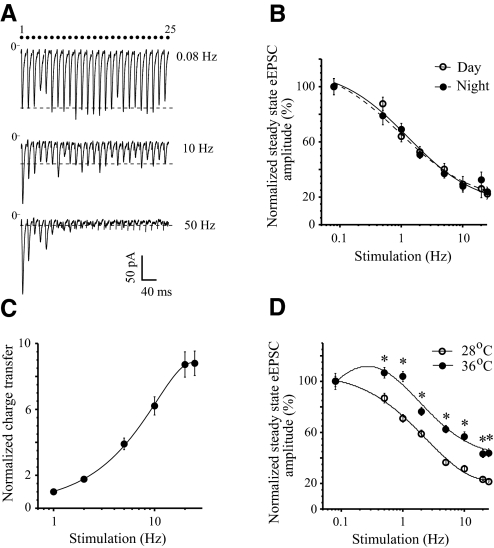
Fig. 1.
Frequency dependence of synaptic depression during repetitive stimulation of the optic chiasm. A: evoked excitatory postsynaptic currents (eEPSCs) were recorded from the same neuron during trains of 25 stimuli at 0.08, 10, and 50 Hz (the onset latency of eEPSC: 4.72 ± 0.05 ms). Each eEPSC recording is an average of (n) trials: 0.08 Hz (n = 3), 10 Hz (n = 7), 50 Hz (n = 10). Note: these records are not shown on a timescale (the dots show the stimuli number). Dashed line is the steady-state eEPSC amplitude (mean of last 10 eEPSCs in the train). B: the frequency dependence of the steady-state eEPSC amplitude during the subjective day (Zeitgeber Time [ZT]: 6.5–10.0; n = 10) and night (ZT: 13.5–17.0; n = 7). C: frequency dependence of the cumulative charge transfer estimated during the first second of 1–25 Hz stimulation. Data were normalized to the charge transfer at 1 Hz and averaged across the recorded neurons: means ± SE (n = 5). D: temperature dependence of synaptic depression. eEPSCs were recorded from the same neurons at 28 and 36°C. *P < 0.001, n = 4 (paired t-test, 2-tailed). B and D: the amplitude of each eEPSC was normalized (%) to the amplitude of the first eEPSC in the stimulus train, after which the steady-state eEPSC amplitude was calculated. In some cases the error bars were sometimes smaller than the symbols.

