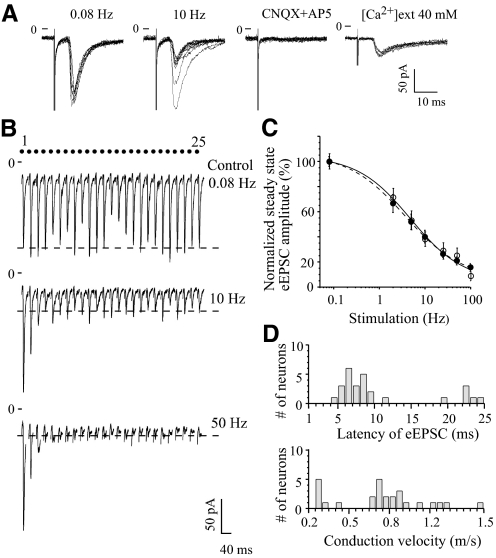
Fig. 2.
Monosynaptic glutamatergic transmission in retinohypothalamic (RHT) synapses revealed depression during repetitive stimulation of the optic nerve. A: EPSC evoked by optic nerve stimulation in the same neuron. From left to right: superposition of 10 recordings during 0.08 Hz (control) and 10 Hz stimulation (the recording demonstrates the constant latency and persistence of the response during high-frequency stimulation), block of eEPSC during 6-cyano-7-nitroquinoxaline-2,3-dione (CNQX, 20 μM) and d-(−)-2-amino-5-phosphonopentanoic acid (d-AP5, 50 μM) coapplication, persistence of eEPSC in 40 mM extracellular Ca2+ (0.08 Hz stimulation). B: EPSCs evoked in the same neuron by 0.08, 10, and 50 Hz stimulation of the optic nerve with trains of 25 stimuli. Each eEPSC recording is an average of 3 trials. Note: these records are not shown on a timescale (the dots show the stimuli number). Dashed line: the mean eEPSC amplitude during steady state. C: frequency dependence of steady-state eEPSC amplitude during optic nerve stimulation. The amplitude of eEPSC was normalized (see Fig. 1). Open circles: neurons satisfying all the criteria for monosynaptic transmission (n = 9); black circles: other recorded neurons that were not tested for monosynaptic transmission (n = 12). P ≥ 0.28 for all applied stimulus frequencies (unpaired t-test, 2-tailed). D: the distribution of eEPSCs onset latency (top) and the conduction velocity of the optic nerve fibers (bottom) (n = 27 neurons).

