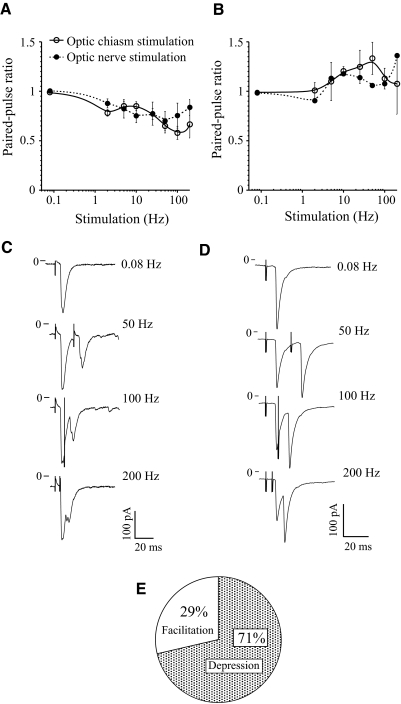
Fig. 5.
Synaptic depression and facilitation during paired-pulse stimulation (PPS) of optic nerve and optic chiasm. A: synaptic depression during optic nerve (n = 7) and optic chiasm (n = 8) PPS. B: facilitation during optic nerve (n = 2) and optic chiasm (n = 4) PPS. A and B: paired-pulse ratio (PPR) estimated as a ratio of the mean amplitude of the second EPSC to the mean amplitude of the first EPSC (mean EPSC2/mean EPSC1). For all applied stimulus frequencies P ≥ 0.11 for depression and P ≥ 0.33 for facilitation (unpaired t-test, 2-tailed). C and D: EPSC recordings in 2 neurons during 0.08 Hz (control) and 50 to 200 Hz PPS of the optic nerve. C: synaptic depression (mean of 5 sweeps). D: facilitation (mean of 35 sweeps). The stimulus artifact is shown attenuated. E: percentage of the neurons demonstrating depression or facilitation during PPS.

