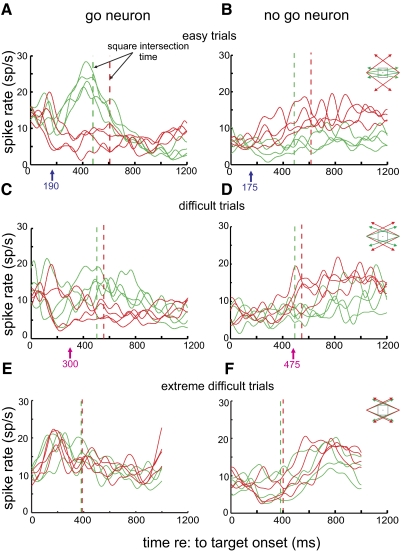
Fig. 5.
Neural activity recorded from example go and nogo neurons in easy, difficult, and extremely difficult trials. Each curve represents the mean spike rate for targets of a specific motion trajectory (green: go; red: nogo). Same-color dashed lines indicate corresponding square intersection times. The arrows below the panels indicate the separation time for all go and nogo trials with the mean spike rate of all trajectories pooled. A: mean spike rates of a typical go neuron in easy go and nogo trials. B: mean spike rates of a typical nogo neuron in easy trials. C: mean spike rates of the same go neuron in difficult trials. D: mean spike rates of the same nogo neuron in difficult trials. E: mean spike rates of a go neuron in extremely difficult trials. F: mean spike rates of a nogo neuron in extremely difficult trials.

