Fig. 3.
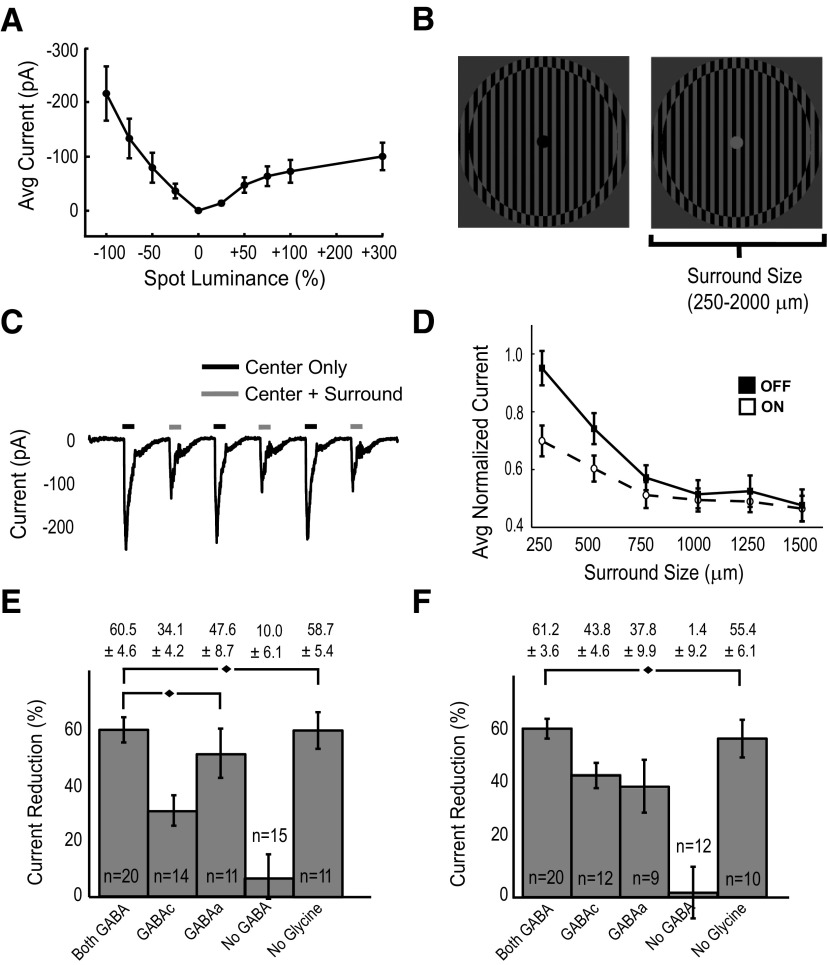
Luminance response, inhibitory receptive field size, and pharmacology of presynaptic inhibition. A: average current recordings in response to 200-μm spots of varying luminance levels from −100% to +300%. Error bars = SE, n = 10. B: stimuli used in C–F. The center 150 μm was either solid on (+300% luminance) or off (−100% luminance). All stripes were 50 μm and inverted luminance polarity at 2 Hz for 3 s. The area that was inverted could be varied (from 250 to 1,500 μm for D, or the entire 2,000 μm for C, E, and F). C: an example excitatory current trace (for an off center spot) in response to center only (spot) stimulation vs. center plus surround (spot plus inverting gratings) stimulation. D: average normalized excitatory current of off and on center spot stimulation for increasing areas of inverting gratings in the surround. All current levels were normalized against a solid 150-μm center spot. Error bars = SE, n = 17 for the off system, n = 20 for the on system. E and F: average excitatory current reduction of center spot stimulation when full-field inverting gratings are used in the surround for the off spot (E) or for the on spot (F). Bars represent the percentage of this reduction under various pharmacologic conditions, labeled by which receptor system(s) remains intact after pharmacologic blockage. Error bars = SE, n values as indicated for each condition. All condition values that are nonsignificant relative to control are indicated with a ♦.

