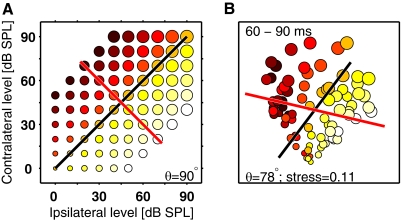
Fig. 5.
Population responses in multidimensional scaling (MDS) space. A: schematic of the stimulus space (Fig. 1A) where color represents ILD and circle diameter represents ABL. Under ideal conditions, one would expect 2-dimensional (2-D) MDS on the neural population responses (see main text) to produce a plot resembling this. The lines are generated by linear regression and indicate the directions that account for the most variance in ILD (red) and ABL (black). θ, the angle between the lines, is equal to 90° because ILD and ABL are orthogonal dimensions in stimulus space. B shows the results of an MDS projection from the 60- to 90-ms time window (part of the onset response) presented in the same format as A. The neural population data produce a map remarkably similar to the stimulus space. ILD and ABL vary in a systematic manner in neural space and the regression lines indicate that these variables are represented along largely orthogonal directions (θ = 78°). Information about these variables is therefore encoded largely independently. The MDS projection provides a good representation of the data because stress, a measure of the success of the transformation, equals 0.11 (0 is a perfect reconstructions; see methods).

