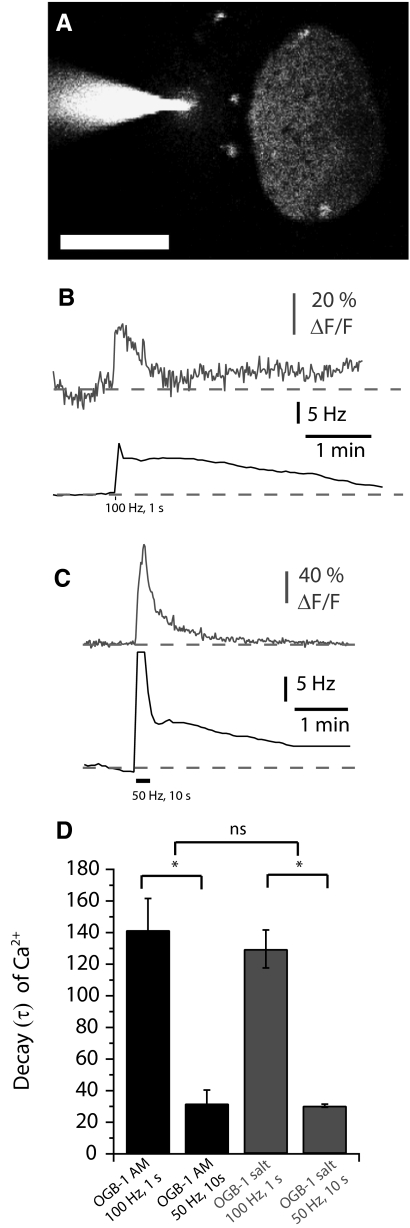
Fig. 4.
Changes in Ca2+ signal within a relay neuron in response to synaptic stimulation. A: cell-impermeant OGB-1 was loaded via a low-resistance sharp electrode into a relay neuron (scale bar = 50 μM). B and C: simultaneous recording of the increases in the PMn firing frequency (Hz, in black) and the increases in fluorescence of the Ca2+-binding dye OGB-1 (ΔF/F, in gray) in a relay neuron in response to synaptic stimulation (B, 100 pulses delivered at 100 Hz; C, 500 pulses delivered at 50 Hz). D: decays of the Ca2+ signal from bulk loaded (in black) and single loaded (in gray) PMn neurons.

