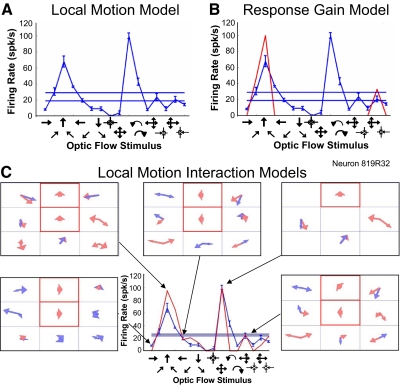
Fig. 10.
Example of transformation of mixture of Gaussians models by local motion interaction effects. A: the local motion model fails to predict the neuronal response to optic flow in this neuron (recorded responses, blue; predicted responses; red, which overlaps the axis to indicate predicted net firing rate of 0 for all optic flow stimuli). B: the response gain model improved the fit to several of the optic flow stimuli but failed to predict the neuronal response to many others. C: the local motion interactions model yielded much better fits to the optic flow responses (lower middle). The 5 frames show the mixture of Gaussians models used for each of the 5 optic flow patterns indicated by the black arrows. In each model, the segments outlined in red were the set sites and their red arrows were the set site directions, used to probe local motion interactions. These experiments yielded unique mixture of Gaussians models for each combination of set site directions, those set site directions specifying the optic flow stimulus to which that model might correspond best. The interactions related to optic flow responsiveness: rightward planar optic flow (lower-left frame), upward planar optic flow (upper-left frame), leftward planar optic flow (upper-middle frame), outward radial optic flow (upper-right frame), and clockwise optic flow (lower-right frame). The differences between the mixture of Gaussians models derived from local motion stimuli in the context of each set site direction provided the basis for the improved predictions of optic flow responses.

