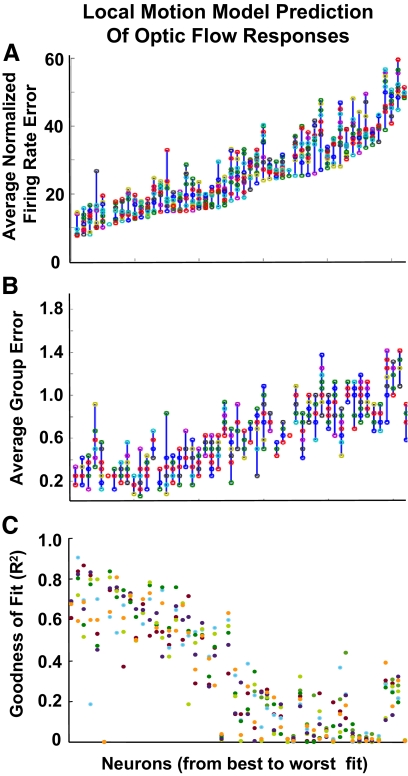
Fig. 4.
Local motion mixture of Gaussians model fits to responses to 16 optic flow stimuli. The neuronal responses to the optic flow stimuli were compared with the model predictions by 3 methods: normalized total errors (A), normalized group errors (B), and the r2 regression fits of the model prediction to the neuronal response data (C). In all panels, the neuron number (abscissa) was maintained in the order of increasing total error to facilitate comparisons between the 3 metrics.

