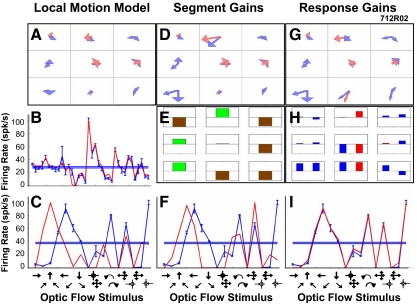
Fig. 6.
The transformation of a neuron's mixture of Gaussians models by response gain modulation. A–F: format as in Fig. 5. G: mixture of Gaussians model after response gain modulation. H: response gain changes that were implemented by the model to modulation the weight of each of the 18 Gaussians (increases, above line; decreases, below line; excitatory Gaussians, red; inhibitory Gaussians, blue; full-scale ±10×). I: fit of the response gain model to the 16 optic flow patterns shows a substantial improvement for all optic flow stimuli compared with both the unmodulated local motion model (C) and the segment gain modulated model (F).

