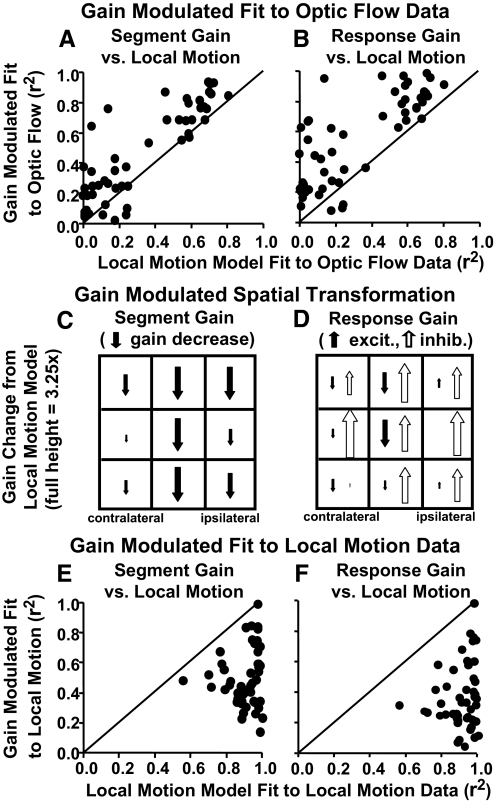
Fig. 7.
Comparison of fits to neuronal responses derived from the local motion models (abscissas) and the 2 approaches to the gain modulation of those models (ordinates). The r2 values are from linear regression fits of each neuron's observed firing rate responses to each model's predicted responses (each data point represents 1 neuron). A and B: the r2's for the correlation between observed and predicted responses to the 16 optic flow stimuli. Both segmental gain (A) and response gain (B) modulated models yielded better fits to the neuronal responses than did the original local motion model as indicated by the points being above the unity line. C and D: the spatial distribution of gain modulations combined across all models for the 9 stimulus segments. The size of each arrow is scaled to reflect relative gains across segments in the models yielding higher r2 increments, downward arrows reflect decreased gains. The distributions for left hemisphere neurons were reversed to match the majority right hemisphere orientation. C: segmental gain modulation resulted in greater declines in the influence of vertical midline more than ipsilateral segments with little effect on contralateral segments. D: response gain modulation resulted in declines in midline excitatory Gaussians (filled arrows) with widespread increases in inhibitory Gaussians (open arrows). E and F: the r2's for the correlation between observed and predicted responses to the 36 local motion stimuli. Both segmental gain (E) and response gain (F) modulated models yielded poorer fits to local motion neuronal responses than did the original local motion response models as indicated by the points being below the unity line.

