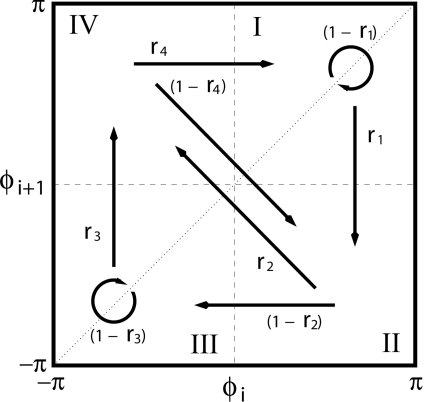
Fig. 1.
Diagram of the 1st-return plot (the phase space). This phase space is partitioned into 4 regions (coinciding with each quadrant, but numbered in a clockwise manner: I–IV). The arrows indicate all possible transitions from one region to another and the expressions next to the arrows indicate the rates for these transitions, computed from experimental data (see First-return maps for the phases and desynchronization events). The sum of the rates for all possible transitions for a given region is equal to 1.

