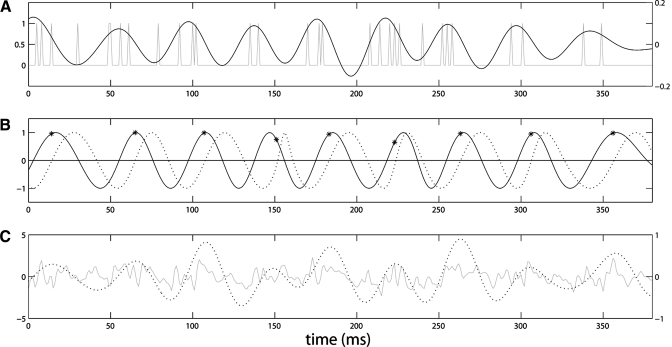
Fig. 2.
Raw and processed data for a short piece of a synchronized episode. A and C: plots contain raw and filtered data. A contains the spikes (gray line) and the spiking signal filtered to 10–30 Hz band (black line); C contains raw local field potential (LFP) signal (gray line) and LFP filtered to 10–30 Hz band (black dotted line). The amplitude is measured in relative units. B: the sines of the phases of the both filtered signal. There is no amplitude information here (both signals vary in between −1 and 1), but the phase information is preserved. One can see that although the signals are not perfectly phase-locked, the deviation of one phase from the other is not very large and is kept constrained. Stars indicate the phases of the filtered spiking signal, when the phase of filtered LFP signal is 0. Thus stars give {φspikes,i}, i = 1, N, from which (φspikes,i,φspikes,i+1) are constructed (see First-return maps for the phases and desynchronization events). The first-return map for this piece of data are presented in Fig. 3.

