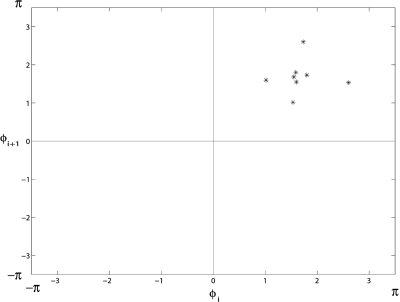
Fig. 3.
The first-return map for the data from the Fig. 2. The points in the depicted phase space are coming from the sequence of the {φspikes,i}, i = 1,…, N indicated by stars at the Fig. 2. All points are within the first region of the phase space, which corresponds to phase-locking, as seen in the Fig. 2.

