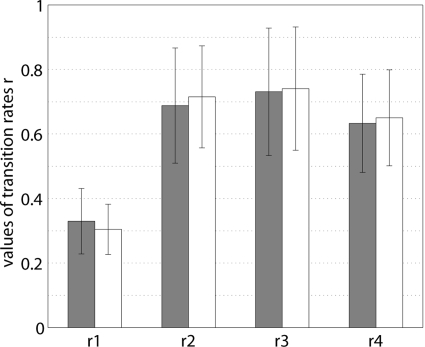
Fig. 6.
The weighted averages of the transition rates r1, r2, r3, r4. The averaging weights are equal to the number of points in the 1st-return plots for each episode.  and ◽, different lengths of the time window used to compute the synchronization index γ (1 s and 1.5, respectively). Note the qualitative similarity with the Fig. 5.

