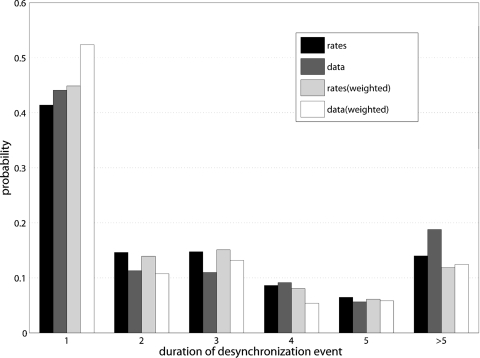
Fig. 7.
The histogram of probabilities of desynchronization events of different durations (measured in cycles of oscillations). For the duration >5, all durations are pooled together, so that the last bin counts all durations >5. Different shades of gray correspond to different evaluation methods: weighted and nonweighted, from data directly and from transition rates. The data are for the window length for the computation of synchronization index γ equal to 1.5 s.

