
Figure 5.
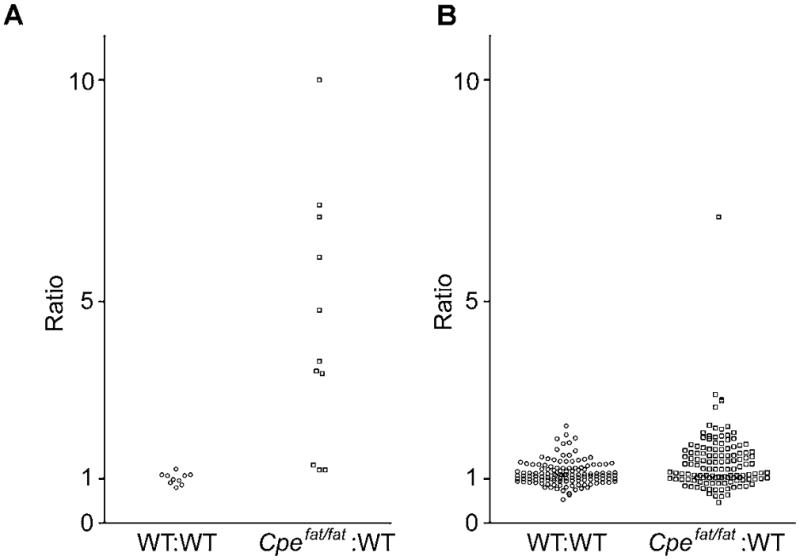
Ratio of hemoglobin-derived and other cytosolic protein-derived peptides in WT:WT and Cpefat/fat:WT mice. A. Relative amounts of hemoglobin-derived peptides in groups of WT mice as compared to other WT mice (left) and Cpefat/fat mice as compared to WT mice (right). Data points with a ratio of “10” refer to a ≥10 fold increase in Cpefat/fat mice as compared to WT mice. For identity of peptides, see Table 2. B. Ratios of peptides derived from cytosolic proteins other than hemoglobin. For identify of peptides, see Table S3.