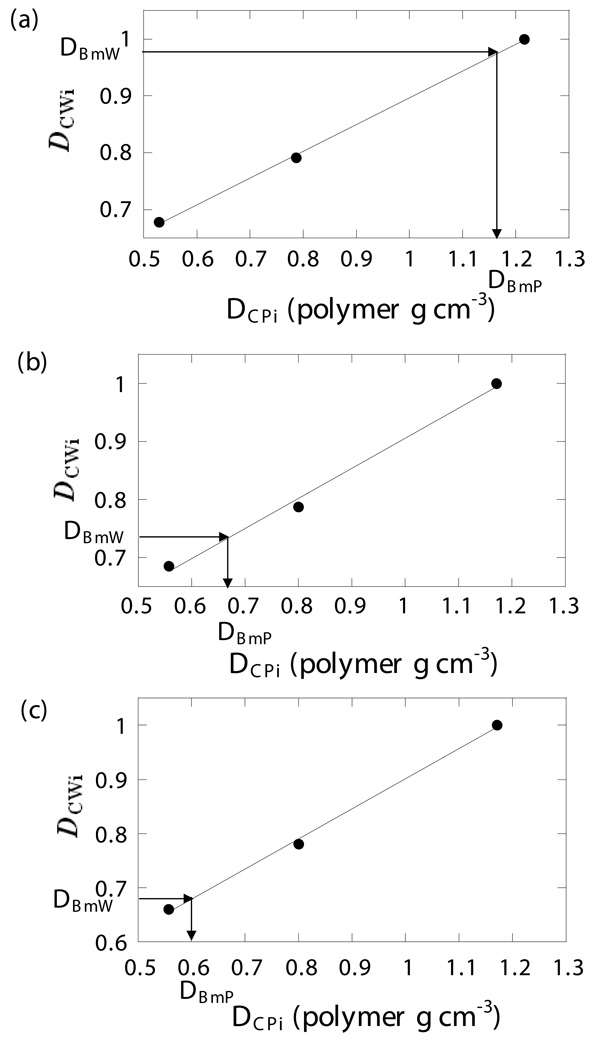
Figure 6. Calibration curves and bone matrix density.
Calibration curves were created by linear regression of the physical densities DCPi of the three polymer calibration pellets to their WASPI densities DCWi. The polymer equivalent bone matrix densities DBmP (expressed in terms of polymer g cm−3) were obtained from the linear regression coefficients from their WASPI densities DBmW. a) Porcine cortical bone specimen 1. b) Porcine trabecular bone specimen 1. c) Bone/glass mixture 1.

