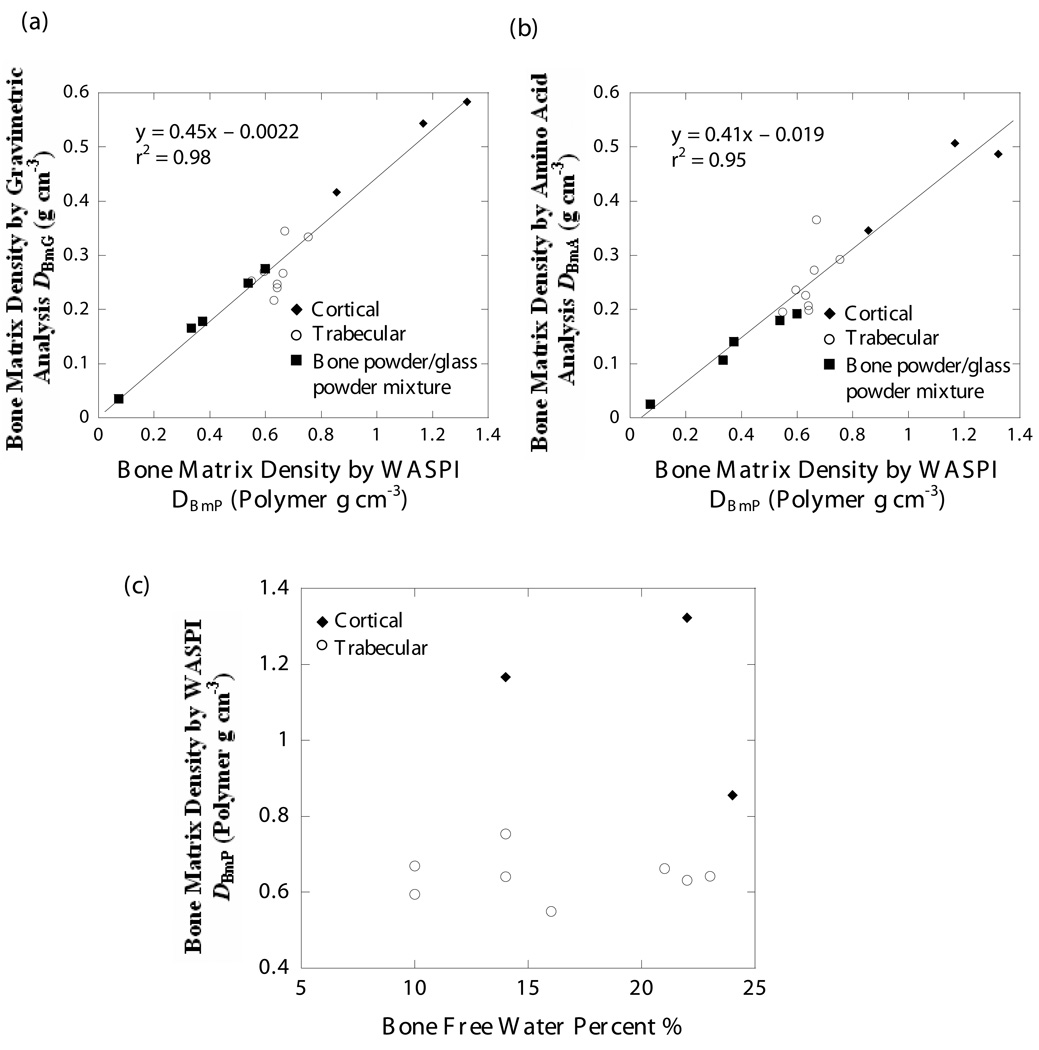
Figure 7. Correlation between WASPI and gravimetric analysis, WASPI and amino acid analysis, WASPI and free bone water content.
a) Correlation between bone matrix density derived by WASPI DBmP (polymer g cm−3) and by gravimetric analysis DBmG (g cm−3). The solid line is the result of a linear regression of data for the 3 cortical, 8 trabecular and 5 bone/glass mixture specimens, which yielded the following relationship: DBmG = 0.45 DBmP – 0.0022; r2 = 0.98. The standard errors of the slope and intercept were 0.03 and 0.02 respectively.
b) Correlation between bone matrix density derived by WASPI DBmP (polymer g cm−3) and by amino acid analysis DBmA (g cm−3). The solid line is the result of a linear regression of data for the 3 cortical, 8 trabecular and 5 bone/sand mixture specimens, which yielded the following relationship: DBmA = 0.41 DBmP – 0.019; r2 = 0.95. The standard errors of the slope and intercept were 0.04 and 0.03 respectively.
c) Relationship between bone matrix density DBmP derived by WASPI (polymer g cm−3) and free water percent in the bone specimens. The water content was obtained by weight loss on drying in the gravimetric analysis. The points are the results of 3 cortical and 8 trabecular bone specimens. There is no significant correlation between WASPI bone matrix density and free water content in the bone specimens.

