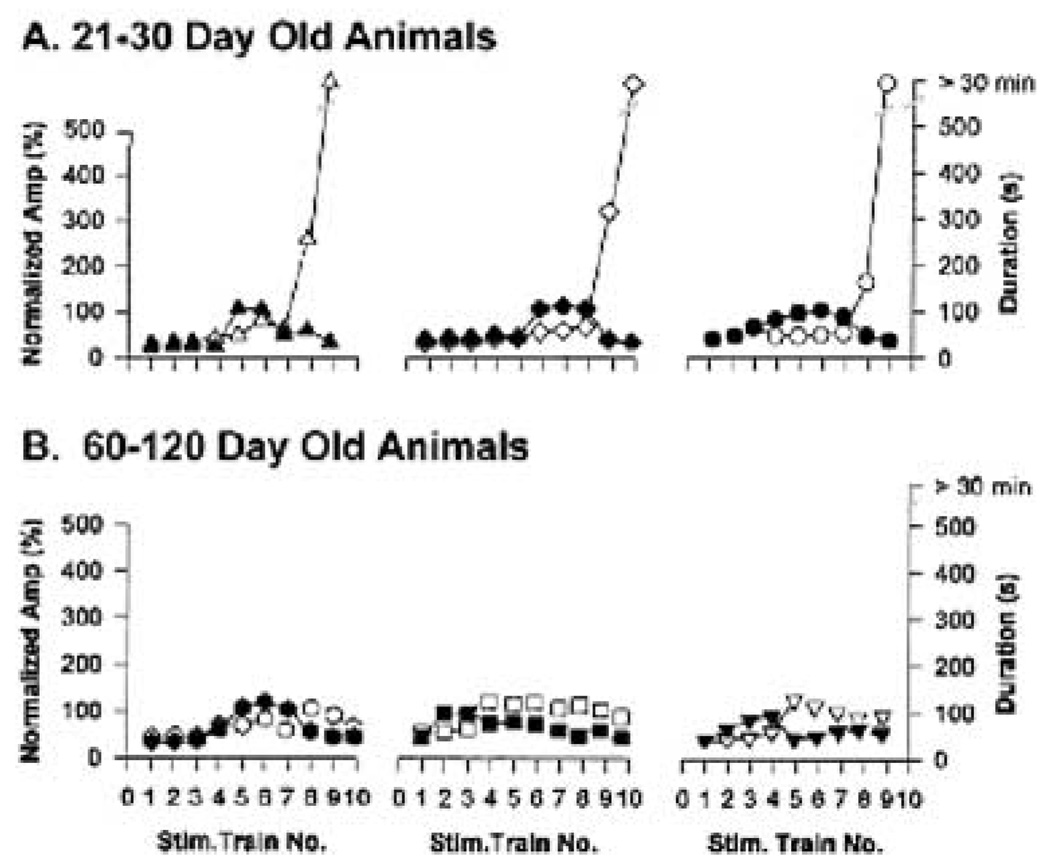
FIG. 2.
Afterdischarge duration and not amplitude is critical for induction of status epilepticus (SE) in hippocampal–entorhinal cortical slices from 21- to 30-day but not from 60- to 120-day-old animals. Plots of CA1 afterdischarge amplitude (normalized to maximal amplitude) and afterdischarge duration against the stimulus train number eliciting the afterdischarge for (A) three slices from 21- to 30-day-old animals, and (B) three slices from 60- to 120-day-old animals. Note that the afterdischarge amplitude plateaus several trains before the induction of SE in all slices, whereas afterdischarge duration continuously increases until SE is induced. Open symbols, the afterdischarge duration; solid (black) symbols, the normalized amplitude. The different symbols used in each graph highlight the fact that each plot presents data from an individual animal.

