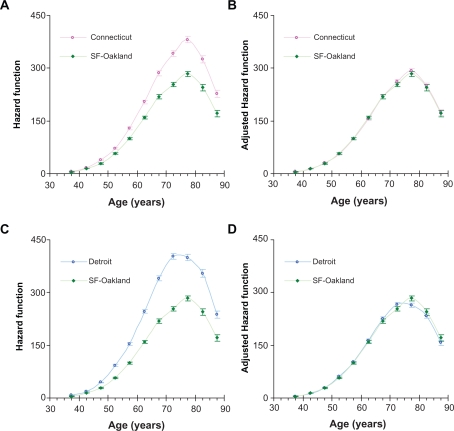
Figure 5.
Comparison of age-specific hazard functions of lung cancer in white men unadjusted (A and C) and adjusted (B and D) for geographical location. Error bars indicate standard errors. A) Unadjusted hazard functions in Connecticut and San Francisco-Oakland. B) Adjusted hazard functions in Connecticut and San Francisco-Oakland (with the San Francisco-Oakland area as the standard). C) Unadjusted hazard functions in Detroit and San Francisco-Oakland area. D) Adjusted hazard functions in Detroit and San Francisco-Oakland (with the San Francisco-Oakland area as the standard).

