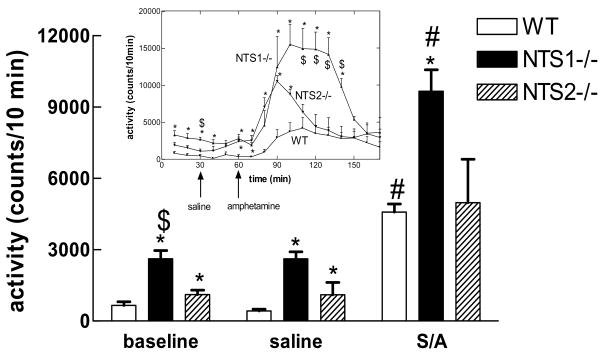
Figure 3. Baseline activity, saline- and d-amphetamine-induced locomotor activity in wild type, NTS1−/−, and NTS2−/− mice.
Activity was recorded in a plexiglass Opto-Varimax Minor activity chamber (Colombus Instruments, Colombus. OH). The mice (n=4–13) were acclimated to the activity chamber for 2h after which baseline activity was recorded for 1h. The mice were then injected with saline and 30min later with saline or d-amphetamine (4 mg/kg i.p.). Activity was recorded for 2h post the last injection. Inset shoes the time course for the baseline. Data is presented as mean ± SEM. P<0.05 is considered significant.
*significantly different from WT; $significantly different from NTS2−/−; #significantly different saline treated animals in the same genotype.
AMP= d-amphetamine
WT=wild type
NTS1−/− =NTS1 knockout mice
NTS2−/− =NTS2 knockout mice
S=saline
A=d-amphetamine

