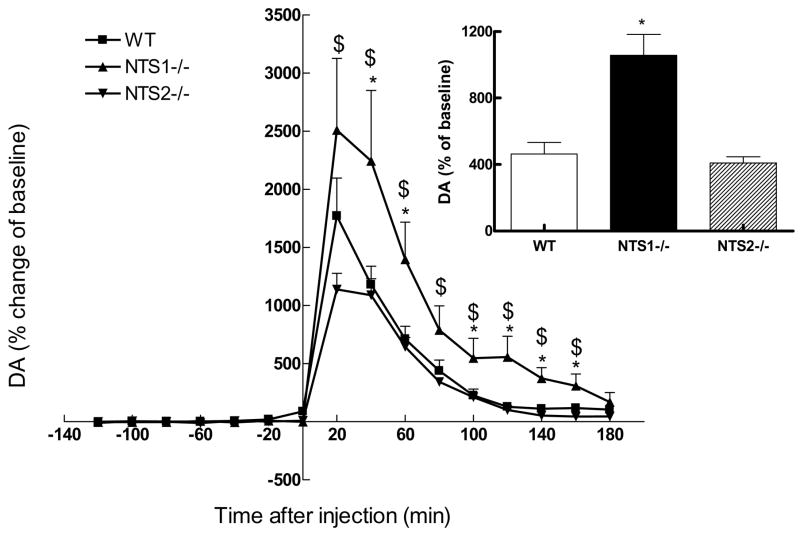
Figure 4. Extracellular DA levels in medial striatum in WT, NTS1−/−, and NTS2−/− mice after d-amphetamine injection (4mg/kg i.p.) as measured by in vivo microdialysis.
Results are expressed as percentage increase above baseline for each strain (average of 6 untreated fractions) and the area under the curve (AUC) as the total percentage of increase above baseline (mean ± S.E.M, n = 4–6 mice). Inset shows the average increase in DA levels after d-amphetamine injection in WT, NTS1−/−, and NTS2−/− mice
*Significantly (P0.05) different from WT
$significantly (P0.05) different from NTS2−/−
WT=wild type
NTS1−/− =NTS1 knockout mice
NTS2−/− =NTS2 knockout mice

