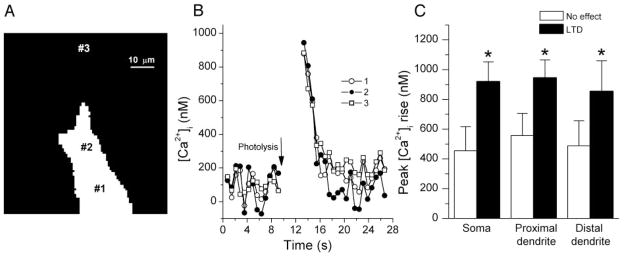
Fig. 5.
Measurement of photolysis-induced [Ca2+]i change. A: photograph of BTC fluorescence from a CA3 pyramidal neuron. Numbers mark where postsynaptic [Ca2+]i transients were measured. B: photolysis-induced Ca2+ transients in the cell body and in proximal and distal dendrites (1, 2, 3 as marked in A). C: higher [Ca2+]i elevation was observed in cells showing long-lasting depression than in those showing no change in transmission at MF synapses.

