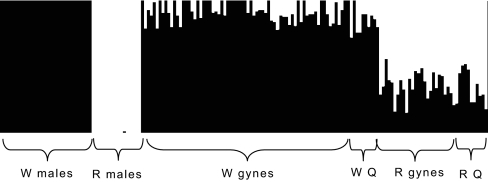
Fig. 1.
Admixture results showing introgression in females. The males were used to define the two gene pools (W and R) and the admixture proportions were estimated for each gyne (n = 95) and old queen (Q; n = 23) by using the Bayesian method implemented in BAPS. Each individual is represented by a vertical bar. The black part indicates the fraction of the genome originating from the W gene pool and the white part the fraction from the R gene pool.

