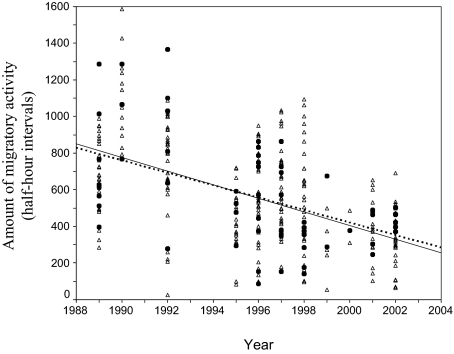
Fig. 2.
Changes in the amount of migratory activity in birds bred in aviaries (F1 generation; open triangles, broken line) and their parents collected in the wild (black dots, solid line). Lines represent the line of a linear regression fitted to the data. Parental data (black dots) are a subset of the data depicted in Fig. 1A.

