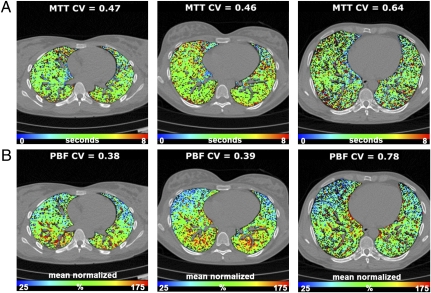
Fig. 2.
Color-coded maps of perfusion parameters overlaid on an imaging slice for a subject in each group. (A) MTT maps for NS (Left), SNI (Center), and SCE (Right) subjects. Maps demonstrate significantly increased regional heterogeneity of MTT measurements in SCE subjects as compared with NS and SNI subjects. Range: 0–8 seconds. (B) PBF normalized to the mean PBF for NS (Left), SNI (Center), and SCE (Right) subjects. As in MTT findings, there is increased regional heterogeneity in mean normalized PBF measurements in SCE subjects compared with NS and SNI subjects. The range on the color scale for MTT is 0-8 seconds and the range for mean normalized PBF is 25–175%.

