Fig. 4.
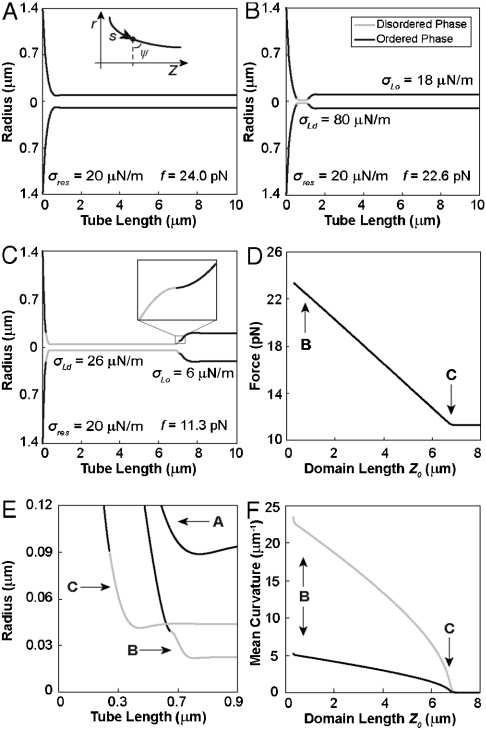
Computational shape series from membrane elasticity theory shows pulling force decay. (A) Single phase tube with an Lo phase bending stiffness of 364 pN·nm. Tube radius is minimal in the neck region. Tube force for this shape is 24.0 pN with a lateral tension of 0.020 mN/m (equivalent reservoir tension for all following shapes). The inset illustrates parameterization of shape coordinates. (B) Three-phase tube with Ld phase domain (gray) with a bending stiffness of 81 pN·nm (4.5 times less than the Lo phase). The Ld domain tension is higher than both the reservoir and Lo phase tube tensions. (C) Tube shape with a large Ld phase domain area. The Ld tension is now close to the reservoir tension. The inset shows leading-edge phase boundary. (D) Tube force decreases linearly with domain length until reaching a plateau. Arrows correspond to shapes in B and C. Note that lateral tensions of the Lo and Ld phase regions of the tube decrease during domain growth. (E) Close-up of neck region for shapes shown in A–C. Vesicle/tube phase boundary moves onto the catenoid during domain growth. (F) Mean curvature of Lo (black) and Ld (gray) phases at the catenoid/tube phase boundary as a function of domain length. Both mean curvatures decrease to zero upon reaching the force plateau shown in D. The curvature on the Ld and Lo phase sides of the phase boundary differ, in accordance with the mechanical jump conditions (see SI Appendix).

