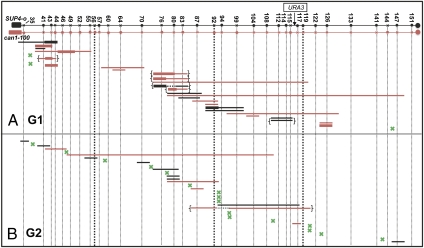
Fig. 3.
Mapping of RCOs and associated conversions in G1- and G2-irradiated cells. The markers are shown at the top with X's and O's indicating the absence and presence of diagnostic restriction sites, respectively. The thick vertical dotted lines mark the divisions that were used in the analysis of the distribution of recombination events (described in the text). Numbers at the top of the figure are the Saccharomyces Genome Database (SGD) coordinates of the markers. Conversion events are shown as horizontal lines with 3:1 events, 4:0 events, and 3:1/4:0 hybrid events indicated by thin lines, thick lines, and hybrid thin/thick lines, respectively. The color of the line shows which chromosome was the donor in the conversion event. Braces indicate complex conversion events and green X's represent RCOs that are not associated with an observable conversion tract. (A) Mapping of 29 RCO events in G1-irradiated cells. (B) Mapping of 31 RCO events in G2-irradiated cells.

