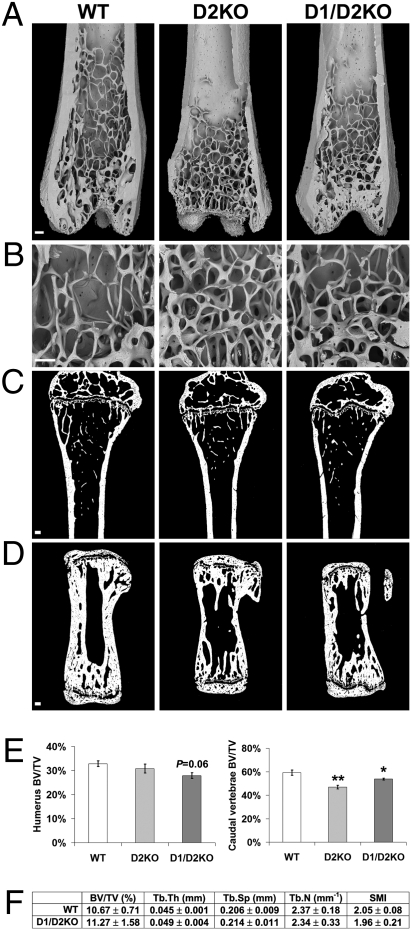
Fig. 4.
Bone microarchitecture in D2KO and D1/D2KO mice. (A and B) BSE-SEM views of distal femur from PD112 WT, D2KO, and D1/D2KO mice. (Scale bars, 200 μm.) (C and D) Sections of proximal humerus and caudal vertebra from PD112 WT, D2KO, and D1/D2KO mice imaged by qBSE SEM. (Scale bars, 200 μm.) (E) Quantitative analysis of bone volume (BV/TV) in PD112 mice. ANOVA and Tukey's post hoc test. *, P < 0.05; **, P < 0.01 versus WT (n = 4). (F) Trabecular bone volume (BV/TV), trabecular thickness (Tb.Th), trabecular spacing (Tb.Sp), trabecular number (Tb.N), and structure model index (SMI) determined by micro-CT analysis of proximal tibia from PD112 D1/D2KO and WT mice (n = 5).

