Fig. 3.
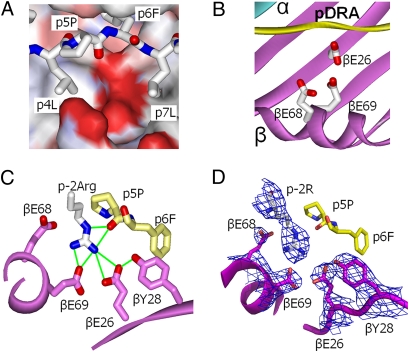
βGlu69 lies in a solvent-exposed acidic pocket. (A) The water-accessible surface of the DP2 molecule (without bound pDRA) is shown in the area between p5Pro and the DP2 β-chain α-helix colored by the relative charge of the surface atoms (red, negative; blue, positive) (Swiss PdbViewer). A wireframe representation of pDRA is also shown with CPK coloring. (B) Same view as A but with ribbon representations of DP2 α (cyan), DP2 β (magenta), and pDRA (yellow). Also shown are wireframe representations of the side chains of βGlu26, βGlu68, and βGlu69 with CPK coloring. (C) View of the acidic pocket looking down the peptide-binding groove from the C terminus of pDRA. Portions of the DP2 β-chain α-helix and β-sheet are shown as magenta ribbons. Wireframe representations of the side chains of βGlu26, βTyr28, βGlu68, and βGlu69 are shown with magenta carbon and red oxygen. A wireframe representation of p4 to p6 of pDRA is shown with yellow carbon, red oxygen, and blue nitrogen. Also shown is a wireframe representation (CPK coloring) of the side chain of the pDRA p-2Arg from a neighboring symmetry-related DP2-pDRA molecule. Green lines connect oxygens in the acidic pocket that potentially could form H bonds or salt bridges to each other or to the nitrogens of the arginine guanidinium group. (D) The same view as in C. In this case, the 2Fo-Fc electron density map around βGlu26, βTry28, βGlu68, and βGlu69 and p-2 Arg is shown, contoured to 1σ.

