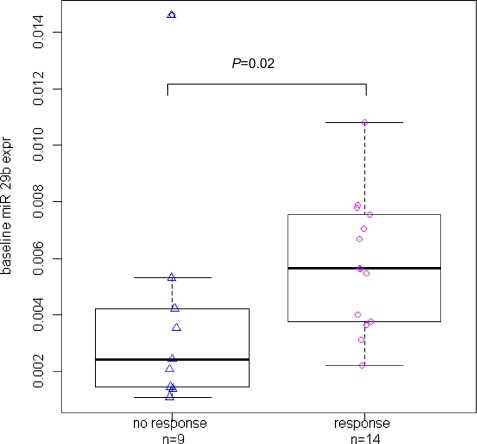
Fig. 4.
Difference in baseline miR-29b expression levels in decitabine between responders vs. nonresponders. Individual patient data are shown as the points in the figure, with the overlaid boxplots showing differences in the distribution of these data. In the boxplots, the thick middle line in the box represents the median baseline miR-29b expression value for that group; the top and bottom edges of the box itself represent the 75th and 25th percentiles, respectively; and the length of the box represents the interquartile range (difference between the 75th and 25th percentile as a measure of spread of the distribution). The P value is from a comparison of the continuous baseline miR-29b expression levels between responders and nonresponders using the nonparametric Wilcoxon rank-sum test.

