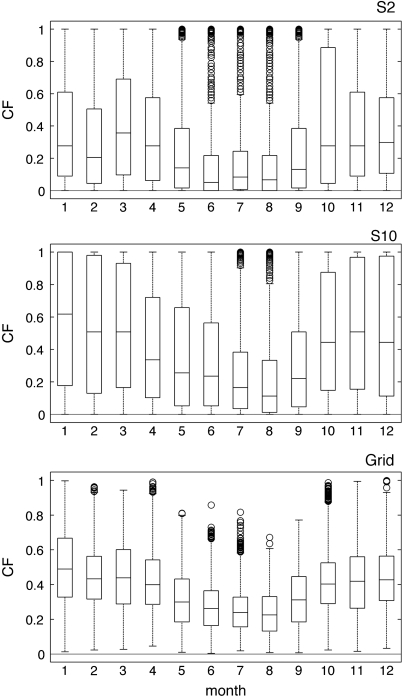
Fig. 4.
Capacity factor monthly variability for individual wind parks at S2, S10, and for Pgrid, shown as boxplots. The central mark in each box is the median; box edges are the 25th and 75th percentiles. The whiskers extend to the most extreme data-points not considered outliers (approximately ± 2.7σ and 99.3% coverage if data is normally distributed). Outliers are plotted as circles.

