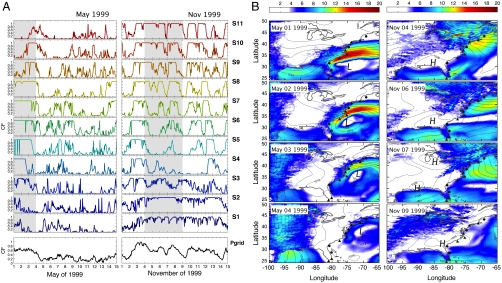
Fig. 6.
(A) Capacity factors for 11 stations in May 1999 and November 1999; line colors match station colors in Fig 1. The lowest graph, Pgrid, is the aggregate CF if all stations are connected by transmission. The two gray date ranges are each expanded to 4 d on the maps (B). (B) Sea level pressure (lines, in hPa) and wind speed (color scale at top, in m s-1) for the events from May 1–4 (Left) and November 4–9 (Right), 1999.

