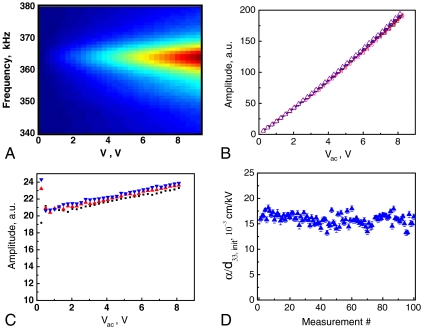
Fig. 2.
Single-point voltage spectroscopy performed at fixed tip location on a 4.04 μm thick PZT film. (A) Single-point two-dimensional spectrum of response as a function of ac bias and frequency. Bias dependence of the (B) response and (C) effective piezoelectric constant, showing several datasets. (D) The response nonlinearity measured at a single point for 100 sequential datasets.

