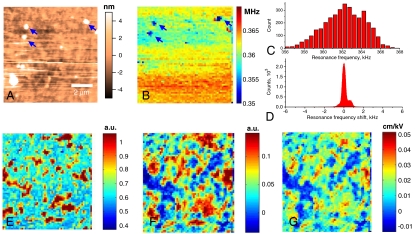
Fig. 3.
Nonlinearity imaging in 1.09 μm thick polycrystalline capacitors. (A) Surface topography and (B) resonance frequency map. Arrows mark the contamination spots and associated frequency shifts. Histograms of (C) position-dependent resonance frequency and (D) shift in resonance frequency as a function of bias dependence at any point (same scale). Maps (arbitrary units) of nonlinear fitting coefficients—(E) slope, a2, (proportional to d33,init) (F) quadratic coefficient, a3 (proportional to αd) and (G) ratio αd/d33,init.

