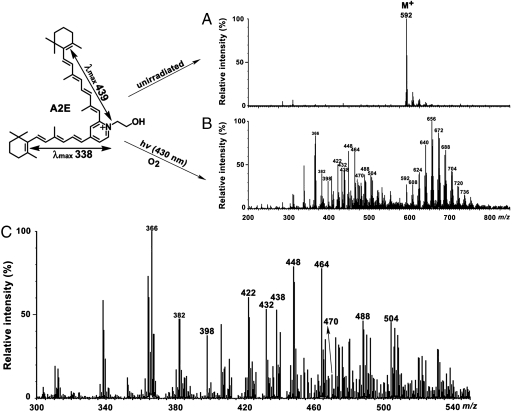
Fig. 3.
ESI mass spectral analysis of A2E (untagged). Samples of A2E (m/z 592) were unirradiated (A) and irradiated at 430 nm (hv) for 30 min (B); expanded view of panel B in the range of m/z 300–540 (C). The series of peaks at m/z 608, 624, 640, 656, 672, 688, 704, 720, and 736 reflect photooxidation (m/z + n ∗ 16; n = 1,2,…,9) at carbon–carbon double bonds (B). Lower mass peaks (< m/z592) correspond to A2E fragments forming due to photooxidation-induced cleavage (panels B and C). Peaks from m/z 422 to 504 that are labeled in bold, correspond to photocleavage products also identified by LC-MS. (Upper Left) Structure of A2E. Absorbance peaks at 439 nm and 338 nm can be assigned to the long and short arms of the molecule, respectively.

