Fig. 1.
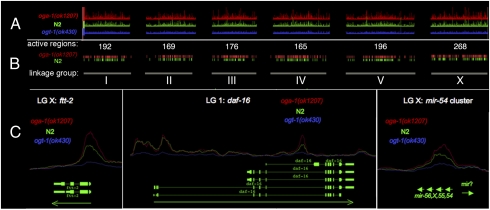
O-GlcNAc marks promoters throughout the C. elegans genome. An antibody specific for O-GlcNAc (RL2) was used for ChIP-on-chip analysis of the C. elegans genome. (A) The peak intensities across all six linkage groups: oga-1(ok1207), red; N2 (wild type), green; ogt-1(ok430), blue. Note that the O-GlcNAc-accumulating mutant oga-1(ok1207) (red) has the highest peak intensities, and the O-GlcNAc-deficient mutant ogt-1(ok430) (blue) displayed weak binding and served as a negative control. (B) A threshold was applied to peak intensities to obtain intervals for oga-1(ok1207) (red) and N2 (green). The number of peaks for each linkage group is shown. (C) Examples of the O-GlcNAc peaks at promoters are shown for two separate genes and a micro RNA. ftt-2 shows a large peak at its promoter. O-GlcNAc marks the first and third promoter of daf-16. The mir-54 cluster is also marked by O-GlcNAc. Green arrows represent direction of transcription.

