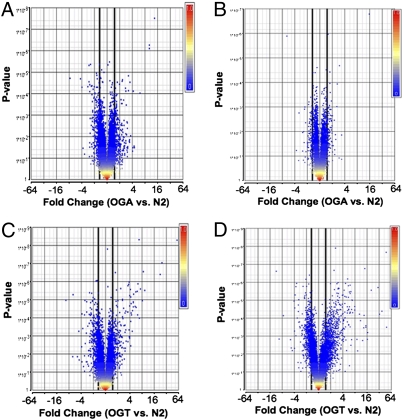
Fig. 3.
O-GlcNAc cycling mutant exhibit deregulation of gene expression. Volcano plots of gene expression, as detected by microarray analysis are shown. (A and B) oga-1(ok1207). (C and D) ogt-1(ok430). Larval stages L1 (A and C) and L4 (B and D) were used for analysis. Data are plotted as geometric fold change (x axis) vs. P value (y axis). Genes were considered significantly deregulated if the geometric fold change was greater than 1.5 (bold black line) with a P value of <0.05.

