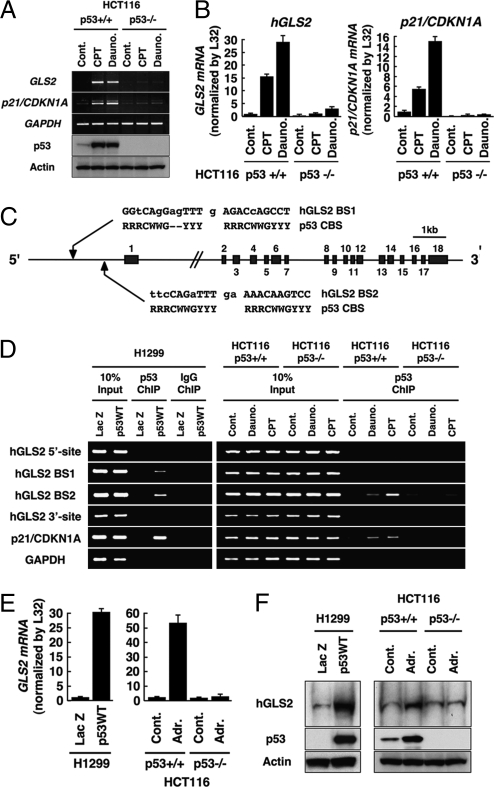
Fig. 1.
Identification of phosphate-activated GLS (GLS2) as a p53-inducible gene. (A) HCT116 (p53+/+) or (p53−/−) cells were treated with camptothecin (CPT; 300 nM) or daunorubicin (Dauno; 200 nM). RT-PCR analysis for GLS2, p21/CDKN1A, and GAPDH expression (top three panels) and immunoblotting to detect p53 (DO1) and actin (Sigma; bottom two panels) were performed. (B) HCT116 cells were treated with indicated agents as in A. Total RNA was subjected to real-time RT-PCR analysis. Expression levels of GLS2 (Left) and p21/CDKN1A (Right) RNAs were determined by the comparative threshold cycle method and then normalized by L32 expression. (C) Genomic structure of human GLS2 with its exon/intron organization and two potential p53 binding sites upstream of the first exon (GLS2 BS1 and GLS2 BS2) compared with the canonical p53 binding site. R, purine; Y, pyrimidine; W, adenine or thymine. (D) H1299 cells infected with adenoviruses expressing either LacZ or p53 (p53WT) for 24 h (Left) and HCT116 (p53+/+) or (p53−/−) cells either not treated (Control) or treated with daunorubicin (200 nM) or CPT (300 nM) for 24 h (Right) were processed for ChIP assays using anti-p53 (DO1/1801) or control IgG (Santa Cruz Biotechnology), followed by the amplification of p53 binding sites as indicated. (E) H1299 cells (Left) were infected with adenoviruses expressing either LacZ or p53 (p53WT) or HCT116 cells (p53+/+; Right) or (p53−/−) cells were treated with doxorubicin (Adr., 0.3 μM) for 24 h. Expression level of GLS2 mRNA was determined as in B. (F) Cells were treated as in E and subjected to mitochondrial fractionation. Immunoblotting was performed to detect GLS2 protein in the mitochondrial fraction and p53 and actin from whole extracts.

