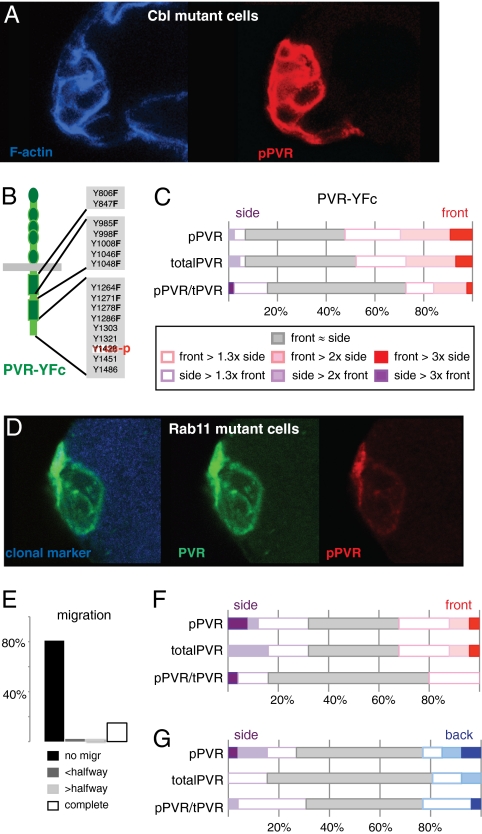
Fig. 5.
Effects of perturbing Cbl or Rab11 on active PVR in border cells. (A) Image of Cbl homozygous mutant border cell clone, showing elevated anti-pPVR (red); compare with controls in Figs. 2A and 3A. (B) Schematic of PVR-YFc, a PVR mutant that does not bind Cbl-SH2 directly (16) but retains the pPVR epitope. (C) Distribution of signal ratios for pPVR, totalPVR, and pPVR/totalPVR at front versus side in the front border cell expressing PVR-YFc at initiation of migration; calculated and scored as in Fig. 3D; n = 53. (D) Image of Rab11 homozygous mutant border cell clone (mutant cells marked by absence of blue) at early stage 9, stained with anti-PVR (green) and anti-pPVR (red). (E) Quantification of border cell migration at stage 10 from Rab11 mutant border cells with slbo-Gal4 + UAS-PVR; n = 47; for control, see Fig. S1. (F) Distribution of signal ratios for pPVR, totalPVR, and pPVR/totalPVR at front versus side of front cells of Rab11 mutant clusters initiating migration as in E, calculated and scored as in Fig. 3D; n = 25. (G) Distribution of signal ratios for pPVR, totalPVR, and pPVR/totalPVR at back versus side of back Rab11 mutant cells during migration; n = 26. Measurements are from mixed clusters in which some cells are homozygous mutant for Rab11. Control genotype and scoring details in Fig. 4D.

