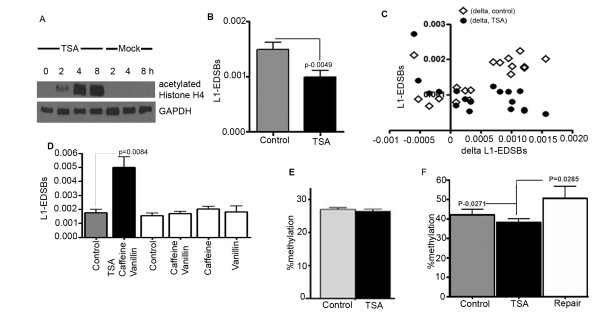
Figure 3.
L1-EDSBs and TSA. (A) Immunoblot of acetylated histone H4 showing an increase in histone acetylation at 2 hrs after TSA treatment, saturation at 4 hrs and persistence up to 8 hrs. HeLa cells treated with TSA and vehicle control. (B) Comparison between L1-EDSBs of HeLa cells treated with TSA for 4 hrs and control cells. (C) Comparison of decreased L1-EDSBs on X axis and L1-EDSB levels of controls or tests on Y axis. Delta L1-EDSBs was decreased L1-EDSBs which was the levels of L1-EDSBs of control minus TSA. L1-EDSBs of control were ◇, and TSA were ● (D) Comparison between L1-EDSBs of HeLa cells treated with several combinations of TSA, caffeine and vanillin for 4 hrs and the control. (E) Comparison between COBRA-L1 analysis of control and TSA-treated cells. (F) Methylation levels of L1-EDSB of control, HeLa cells treated with TSA and repaired EDSBs, following the formula {(% methylation of L1-EDSB × L1-EDSBs) of control - (% methylation of L1-EDSB × L1-EDSBs) of test}/(L1-EDSB of control - L1-EDSB of test). Tests were HeLa cells treated with TSA. (B, C, E and F) Data represent means ± SEM.

